VIT

VARIABLE INSURANCE TRUST PORTFOLIOS

The TOPS® ETF Portfolios and TOPS® Managed Risk Portfolios are Variable Insurance
Trust (VIT) Portfolios and are offered through variable annuities and variable life insurance in more than 15 different insurance platforms.

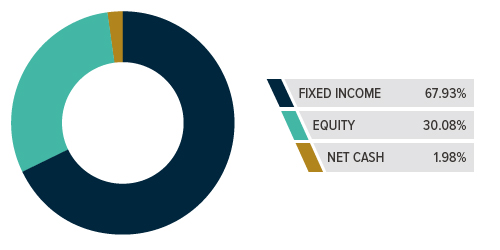
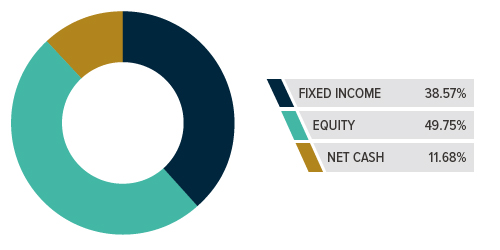
TOPS® Conservative ETF Portfolio

TOPS® Conservative ETF Portfolio

ABOUT

TOPS_Conservative

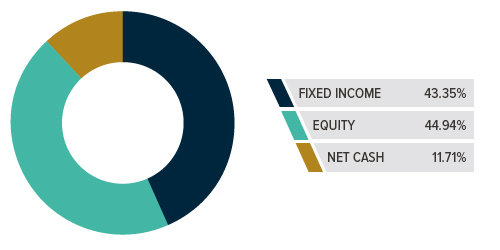
Allocation data is as of the most recently filed report. Portfolio allocations are subject to change and should not be considered investment advice.

The TOPS® Conservative Portfolio seeks to preserve capital and provide moderate income and moderate capital appreciation.

ValMark believes the Portfolio is appropriate for investors with short-term to intermediate-term investment horizons who seek capital preservation as well as the opportunity for modest income and modest capital appreciation.

The Portfolio employs a fund-of-funds structure that invests at least 80% of its assets in ETFs. The ETFs included in the portfolio provide exposure to Government and Fixed Income Securities, Corporate Fixed Income Securities, Common and Preferred Stocks, Real Estate-Related Securities and Natural Resource- Related Securities.

PERFORMANCE

The performance figures do not reflect charges specific to an individual’s contract, such as cost of insurance, mortality and expense risks charges, riders and sales charges, which would negatively affect performance. Returns greater than one year are annualized. Performance is provided based on rolling periods. PERFORMANCE DATA QUOTED REPRESENTS PAST PERFORMANCE AND DOES NOT GUARANTEE FUTURE RESULTS. Investment return and principal value of an investment will fluctuate so that an investor’s shares, when redeemed, may be worth more or less than their original cost. Current performance may be lower or higher than the performance data quoted. For more information, including performance data current to the most recent month-end, please call 1-855-572-5945. Please consider the investment objectives, risks, charges and expenses of any investment option before investing.

Fund Prices & YTD Returns as of
1/1/1970
Performance Through
1/1/1970
Average Annual Returns Through
6/30/2026
Portfolio Name NAV NAV Daily Change % Daily Change % YTD Return One Month Three Months Six Months Since Inception One Year Three Years Five Years Ten Years Since Inception Inception Date Gross Expenses
TOPS Conservative ETF Portfolio Class 1 0.00 0.00 0.00% 0.00% 0.00% 0.00% 0.00% 0.00% 10.27% 8.89% 4.71% 5.35% 4.74% 4/26/2011 0.31%
TOPS Conservative ETF Portfolio Class 2 0.00 0.00 0.00% 0.00% 0.00% 0.00% 0.00% 0.00% 9.96% 8.62% 4.44% 5.09% 4.49% 4/26/2011 0.56%
TOPS Conservative ETF Portfolio Investor Class 0.00 0.00 0.00% 0.00% 0.00% 0.00% 0.00% 0.00% 9.66% 8.36% 4.18% 4.87% 4.54% 7/22/2015 0.81%

This material must be preceded or accompanied by a prospectus, which outlines specific charges and expenses associated with the product, a hypothetical illustration showing the effect on performance of various assumptions regarding the cost of insurance protection, among other important information. Individuals may also obtain a personalized illustration of historical performance, which reflects the cost of the individual’s policy insurance protection. Please review this material with a current variable annuity prospectus, product material (product brochure or illustration) and the current monthly performance for the specific product.

TOPS® ETF Portfolios assess fees and expenses that are separate and distinct from each respective underlying insurance contract or fund option.

Please read the product and fund prospectuses carefully before you invest or send money. Investors should consider the investment objectives, strategies, risk factors, charges and expenses of the underlying variable portfolios carefully before investing. The fund prospectus contains this and other information about the underlying variable portfolios.

There is the risk that you could lose money through your investment in the portfolios. Many factors affect the portfolios’ net asset value and performance. The portfolios may be subject to credit risk where issuers might not make payments on debt securities, resulting in losses. Fixed income investments are affected by a number of risks, including fluctuation in interest rates, credit risk, and prepayment risk. In general, as prevailing interest rates rise, fixed income prices will fall. Real estate values rise and fall in response to a variety of factors, including local, regional and national economic conditions, interest rates and tax considerations.

By investing in ETFs, the cost of investing in a portfolio will be higher than the cost of investing directly in the ETFs and may be higher than other mutual funds that invest directly in stocks and bonds. Foreign investing involves risks not typically associated with U.S. investments, including adverse fluctuations in foreign currency values, adverse political, social and economic developments, less liquidity, greater volatility, less developed or less efficient trading markets, political instability and differing auditing and legal standards. Foreign equity securities denominated in non-U.S. dollar currencies will subject a portfolio to currency trading risks that include market risk and country risk. It is possible to lose money by investing in securities.

The portfolio’s positions in lower-quality bonds, known as “high yield” or “junk” bonds, present greater risk than bonds of higher quality, including an increased risk of default. The portfolios’ exposure to companies primarily engaged in the natural resource markets may subject a portfolio to greater volatility than the securities market as a whole. Natural resource companies are affected by commodity price volatility, changes in interest rates, or factors affecting a particular industry or commodity, such as drought, floods, weather, livestock disease, embargoes, tariffs, and international economic, political and regulatory developments. Positions in small or medium capitalization company stocks may subject the portfolios to additional risk since they are subject to more abrupt or erratic market movements than those of larger, more established companies.

PORTFOLIO DOCUMENTS

Click here to access fund documents.

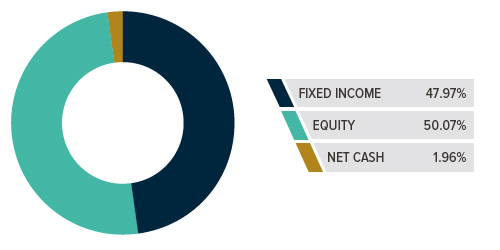
TOPS® Balanced ETF Portfolio

TOPS® Balanced ETF Portfolio

ABOUT

TOPS_Balanced

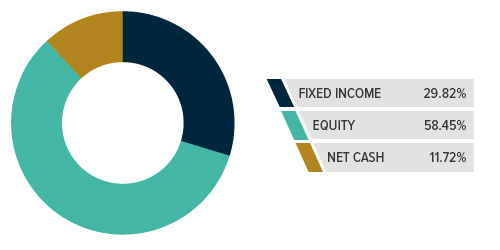
Allocation data is as of the most recently filed report. Portfolio allocations are subject to change and should not be considered investment advice.

The TOPS® Balanced ETF Portfolio seeks income and capital appreciation.

ValMark believes the Portfolio is appropriate for investors with intermediate term to long-term investment horizons who seek to balance out a desire for investment returns with a desire for lower levels of risk than typically found in funds with more aggressive asset allocation.

The Portfolio employs a fund-of-funds structure that invests 80% of its assets in ETFs. The ETFs included in the portfolio provide exposure to Government Fixed Income Securities, Corporate Fixed Income Securities, Common and Preferred Stocks, Real Estate-Related Securities and Natural Resource- Related Securities.

PERFORMANCE

The performance figures do not reflect charges specific to an individual’s contract, such as cost of insurance, mortality and expense risks charges, riders and sales charges, which would negatively affect performance. Returns greater than one year are annualized. Performance is provided based on rolling periods. PERFORMANCE DATA QUOTED REPRESENTS PAST PERFORMANCE AND DOES NOT GUARANTEE FUTURE RESULTS. Investment return and principal value of an investment will fluctuate so that an investor’s shares, when redeemed, may be worth more or less than their original cost. Current performance may be lower or higher than the performance data quoted. For more information, including performance data current to the most recent month-end, please call 1-855-572-5945. Please consider the investment objectives, risks, charges and expenses of any investment option before investing.

Fund Prices & YTD Returns as of
1/1/1970
Performance Through
1/1/1970
Average Annual Returns Through
6/30/2026
Portfolio Name NAV NAV Daily Change % Daily Change % YTD Return One Month Three Months Six Months Since Inception One Year Three Years Five Years Ten Years Since Inception Inception Date Gross Expenses
TOPS Balanced ETF Portfolio Class 1 0.00 0.00 0.00% 0.00% 0.00% 0.00% 0.00% 0.00% 14.87% 11.25% 5.88% 6.94% 6.11% 4/26/2011 0.30%
TOPS Balanced ETF Portfolio Class 2 0.00 0.00 0.00% 0.00% 0.00% 0.00% 0.00% 0.00% 14.62% 10.99% 5.62% 6.68% 5.80% 4/26/2011 0.55%
TOPS Balanced ETF Portfolio Investor Class 0.00 0.00 0.00% 0.00% 0.00% 0.00% 0.00% 0.00% 14.34% 10.71% 5.35% 6.39% 5.90% 7/22/2015 0.80%

This material must be preceded or accompanied by a prospectus, which outlines specific charges and expenses associated with the product, a hypothetical illustration showing the effect on performance of various assumptions regarding the cost of insurance protection, among other important information. Individuals may also obtain a personalized illustration of historical performance, which reflects the cost of the individual’s policy insurance protection. Please review this material with a current variable annuity prospectus, product material (product brochure or illustration) and the current monthly performance for the specific product.

TOPS® ETF Portfolios assess fees and expenses that are separate and distinct from each respective underlying insurance contract or fund option.

Please read the product and fund prospectuses carefully before you invest or send money. Investors should consider the investment objectives, strategies, risk factors, charges and expenses of the underlying variable portfolios carefully before investing. The fund prospectus contains this and other information about the underlying variable portfolios.

There is the risk that you could lose money through your investment in the portfolios. Many factors affect the portfolios’ net asset value and performance. The portfolios may be subject to credit risk where issuers might not make payments on debt securities, resulting in losses. Fixed income investments are affected by a number of risks, including fluctuation in interest rates, credit risk, and prepayment risk. In general, as prevailing interest rates rise, fixed income prices will fall. Real estate values rise and fall in response to a variety of factors, including local, regional and national economic conditions, interest rates and tax considerations.

By investing in ETFs, the cost of investing in a portfolio will be higher than the cost of investing directly in the ETFs and may be higher than other mutual funds that invest directly in stocks and bonds. Foreign investing involves risks not typically associated with U.S. investments, including adverse fluctuations in foreign currency values, adverse political, social and economic developments, less liquidity, greater volatility, less developed or less efficient trading markets, political instability and differing auditing and legal standards. Foreign equity securities denominated in non-U.S. dollar currencies will subject a portfolio to currency trading risks that include market risk and country risk. It is possible to lose money by investing in securities.

The portfolio’s positions in lower-quality bonds, known as “high yield” or “junk” bonds, present greater risk than bonds of higher quality, including an increased risk of default. The portfolios’ exposure to companies primarily engaged in the natural resource markets may subject a portfolio to greater volatility than the securities market as a whole. Natural resource companies are affected by commodity price volatility, changes in interest rates, or factors affecting a particular industry or commodity, such as drought, floods, weather, livestock disease, embargoes, tariffs, and international economic, political and regulatory developments. Positions in small or medium capitalization company stocks may subject the portfolios to additional risk since they are subject to more abrupt or erratic market movements than those of larger, more established companies.

PORTFOLIO DOCUMENTS

Click here to access fund documents.

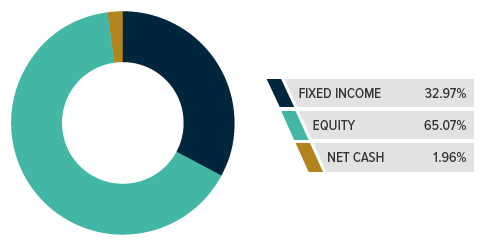
TOPS® Moderate ETF Portfolio

TOPS® Moderate ETF Portfolio

TOPS® Moderate ETF Portfolio

Allocation data is as of the most recently filed report. Portfolio allocations are subject to change and should not be considered investment advice.

ABOUT

The TOPS® Moderate ETF Portfolio seeks capital appreciation.

ValMark believes the Portfolio is appropriate for investors with long-term investment horizons who are willing to accept moderate return volatility in pursuit of higher returns than are typically found in funds with more conservative asset allocation.

The Portfolio employs a fund-of-funds structure that invests 80% of its assets in ETFs. The ETFs included in the portfolio provide exposure to Government Fixed Income Securities, Corporate Fixed Income Securities, Common and Preferred Stocks, Real Estate-Related Securities and Natural Resource- Related Securities.

PERFORMANCE

The performance figures do not reflect charges specific to an individual’s contract, such as cost of insurance, mortality and expense risks charges, riders and sales charges, which would negatively affect performance. Returns greater than one year are annualized. Performance is provided based on rolling periods. PERFORMANCE DATA QUOTED REPRESENTS PAST PERFORMANCE AND DOES NOT GUARANTEE FUTURE RESULTS. Investment return and principal value of an investment will fluctuate so that an investor’s shares, when redeemed, may be worth more or less than their original cost. Current performance may be lower or higher than the performance data quoted. For more information, including performance data current to the most recent month-end, please call 1-855-572-5945. Please consider the investment objectives, risks, charges and expenses of any investment option before investing.

Fund Prices & YTD Returns as of
1/1/1970
Performance Through
1/1/1970
Average Annual Returns Through
6/30/2026
Portfolio Name NAV NAV Daily Change % Daily Change % YTD Return One Month Three Months Six Months Since Inception One Year Three Years Five Years Ten Years Since Inception Inception Date Gross Expenses
TOPS Moderate ETF Portfolio Class 1 0.00 0.00 0.00% 0.00% 0.00% 0.00% 0.00% 0.00% 18.45% 13.58% 7.24% 8.69% 7.31% 4/26/2011 0.29%
TOPS Moderate ETF Portfolio Class 2 0.00 0.00 0.00% 0.00% 0.00% 0.00% 0.00% 0.00% 18.11% 13.28% 6.96% 8.43% 7.04% 4/26/2011 0.54%
TOPS Moderate ETF Portfolio Investor Class 0.00 0.00 0.00% 0.00% 0.00% 0.00% 0.00% 0.00% 17.87% 13.01% 6.71% 8.10% 7.31% 7/22/2015 0.79%

This material must be preceded or accompanied by a prospectus, which outlines specific charges and expenses associated with the product, a hypothetical illustration showing the effect on performance of various assumptions regarding the cost of insurance protection, among other important information. Individuals may also obtain a personalized illustration of historical performance, which reflects the cost of the individual’s policy insurance protection. Please review this material with a current variable annuity prospectus, product material (product brochure or illustration) and the current monthly performance for the specific product.

TOPS® ETF Portfolios assess fees and expenses that are separate and distinct from each respective underlying insurance contract or fund option.

Please read the product and fund prospectuses carefully before you invest or send money. Investors should consider the investment objectives, strategies, risk factors, charges and expenses of the underlying variable portfolios carefully before investing. The fund prospectus contains this and other information about the underlying variable portfolios.

There is the risk that you could lose money through your investment in the portfolios. Many factors affect the portfolios’ net asset value and performance. The portfolios may be subject to credit risk where issuers might not make payments on debt securities, resulting in losses. Fixed income investments are affected by a number of risks, including fluctuation in interest rates, credit risk, and prepayment risk. In general, as prevailing interest rates rise, fixed income prices will fall. Real estate values rise and fall in response to a variety of factors, including local, regional and national economic conditions, interest rates and tax considerations.

By investing in ETFs, the cost of investing in a portfolio will be higher than the cost of investing directly in the ETFs and may be higher than other mutual funds that invest directly in stocks and bonds. Foreign investing involves risks not typically associated with U.S. investments, including adverse fluctuations in foreign currency values, adverse political, social and economic developments, less liquidity, greater volatility, less developed or less efficient trading markets, political instability and differing auditing and legal standards. Foreign equity securities denominated in non-U.S. dollar currencies will subject a portfolio to currency trading risks that include market risk and country risk. It is possible to lose money by investing in securities.

The portfolio’s positions in lower-quality bonds, known as “high yield” or “junk” bonds, present greater risk than bonds of higher quality, including an increased risk of default. The portfolios’ exposure to companies primarily engaged in the natural resource markets may subject a portfolio to greater volatility than the securities market as a whole. Natural resource companies are affected by commodity price volatility, changes in interest rates, or factors affecting a particular industry or commodity, such as drought, floods, weather, livestock disease, embargoes, tariffs, and international economic, political and regulatory developments. Positions in small or medium capitalization company stocks may subject the portfolios to additional risk since they are subject to more abrupt or erratic market movements than those of larger, more established companies.

Volatility: a tendency to change quickly and unpredictably.

PORTFOLIO DOCUMENTS

Click here to access fund documents.

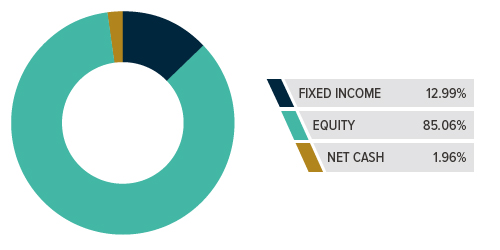
TOPS® Moderately Aggressive ETF Portfolio

TOPS® Moderately Aggressive ETF Portfolio

TOPS® Moderately Aggressive ETF Portfolio

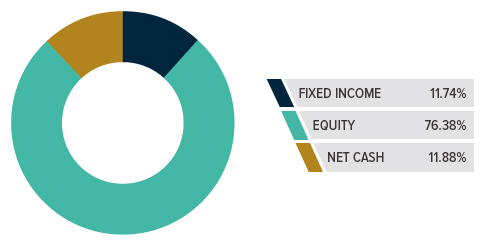
Allocation data is as of the most recently filed report. Portfolio allocations are subject to change and should not be considered investment advice.

ABOUT

The TOPS® Moderately Aggressive ETF Portfolio seeks capital appreciation.

ValMark believes the Portfolio is appropriate for investors with long-term investment horizons who are willing to accept higher return volatility in pursuit of higher returns.

The Portfolio employs a fund-of-funds structure that invests 80% of its assets in ETFs. The ETFs included in the portfolio provide exposure to Government Fixed Income Securities, Corporate Fixed Income Securities, Common and Preferred Stocks, Real Estate-Related Securities and Natural Resource- Related Securities.

PERFORMANCE

The performance figures do not reflect charges specific to an individual’s contract, such as cost of insurance, mortality and expense risks charges, riders and sales charges, which would negatively affect performance. Returns greater than one year are annualized. Performance is provided based on rolling periods. PERFORMANCE DATA QUOTED REPRESENTS PAST PERFORMANCE AND DOES NOT GUARANTEE FUTURE RESULTS. Investment return and principal value of an investment will fluctuate so that an investor’s shares, when redeemed, may be worth more or less than their original cost. Current performance may be lower or higher than the performance data quoted. For more information, including performance data current to the most recent month-end, please call 1-855-572-5945. Please consider the investment objectives, risks, charges and expenses of any investment option before investing.

Fund Prices & YTD Returns as of
1/1/1970
Performance Through
1/1/1970
Average Annual Returns Through
6/30/2026
Portfolio Name NAV NAV Daily Change % Daily Change % YTD Return One Month Three Months Six Months Since Inception One Year Three Years Five Years Ten Years Since Inception Inception Date Gross Expenses
TOPS Moderately Aggressive ETF Portfolio Class 1 0.00 0.00 0.00% 0.00% 0.00% 0.00% 0.00% 0.00% 23.94% 16.55% 8.95% 10.58% 9.25% 4/26/2011 0.30%
TOPS Moderately Aggressive ETF Portfolio Class 2 0.00 0.00 0.00% 0.00% 0.00% 0.00% 0.00% 0.00% 23.64% 16.24% 8.68% 10.30% 8.95% 4/26/2011 0.55%
TOPS Moderately Aggressive ETF Portfolio Investor Class 0.00 0.00 0.00% 0.00% 0.00% 0.00% 0.00% 0.00% 23.26% 15.95% 8.42% 9.90% 8.81% 7/22/2015 0.80%

This material must be preceded or accompanied by a prospectus, which outlines specific charges and expenses associated with the product, a hypothetical illustration showing the effect on performance of various assumptions regarding the cost of insurance protection, among other important information. Individuals may also obtain a personalized illustration of historical performance, which reflects the cost of the individual’s policy insurance protection. Please review this material with a current variable annuity prospectus, product material (product brochure or illustration) and the current monthly performance for the specific product.

TOPS® ETF Portfolios assess fees and expenses that are separate and distinct from each respective underlying insurance contract or fund option.

Please read the product and fund prospectuses carefully before you invest or send money. Investors should consider the investment objectives, strategies, risk factors, charges and expenses of the underlying variable portfolios carefully before investing. The fund prospectus contains this and other information about the underlying variable portfolios.

There is the risk that you could lose money through your investment in the portfolios. Many factors affect the portfolios’ net asset value and performance. The portfolios may be subject to credit risk where issuers might not make payments on debt securities, resulting in losses. Fixed income investments are affected by a number of risks, including fluctuation in interest rates, credit risk, and prepayment risk. In general, as prevailing interest rates rise, fixed income prices will fall. Real estate values rise and fall in response to a variety of factors, including local, regional and national economic conditions, interest rates and tax considerations.

By investing in ETFs, the cost of investing in a portfolio will be higher than the cost of investing directly in the ETFs and may be higher than other mutual funds that invest directly in stocks and bonds. Foreign investing involves risks not typically associated with U.S. investments, including adverse fluctuations in foreign currency values, adverse political, social and economic developments, less liquidity, greater volatility, less developed or less efficient trading markets, political instability and differing auditing and legal standards. Foreign equity securities denominated in non-U.S. dollar currencies will subject a portfolio to currency trading risks that include market risk and country risk. It is possible to lose money by investing in securities.

The portfolio’s positions in lower-quality bonds, known as “high yield” or “junk” bonds, present greater risk than bonds of higher quality, including an increased risk of default. The portfolios’ exposure to companies primarily engaged in the natural resource markets may subject a portfolio to greater volatility than the securities market as a whole. Natural resource companies are affected by commodity price volatility, changes in interest rates, or factors affecting a particular industry or commodity, such as drought, floods, weather, livestock disease, embargoes, tariffs, and international economic, political and regulatory developments. Positions in small or medium capitalization company stocks may subject the portfolios to additional risk since they are subject to more abrupt or erratic market movements than those of larger, more established companies.

Volatility: a tendency to change quickly and unpredictably.

PORTFOLIO DOCUMENTS

Click here to access fund documents.

TOPS® Aggressive ETF Portfolio

TOPS® Aggressive ETF Portfolio

TOPS Aggressive ETF  Portfolio

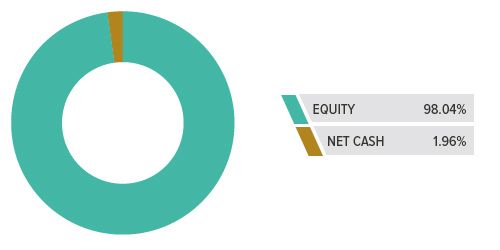
Allocation data is as of the most recently filed report. Portfolio allocations are subject to change and should not be considered investment advice.

ABOUT

The TOPS® Aggressive ETF Portfolio seeks capital appreciation.

ValMark believes the Portfolio is appropriate for investors with long-term investment horizons who are willing to accept lower-to-moderate return volatility in pursuit of higher returns than are typically found in funds with more conservative asset allocation.

The Portfolio employs a fund-of-funds structure that invests 80% of its assets in ETFs. The ETFs included in the portfolio provide exposure to Common and Preferred Stocks, Real Estate-Related Securities and Natural Resource- Related Securities.

PERFORMANCE

The performance figures do not reflect charges specific to an individual’s contract, such as cost of insurance, mortality and expense risks charges, riders and sales charges, which would negatively affect performance. Returns greater than one year are annualized. Performance is provided based on rolling periods. PERFORMANCE DATA QUOTED REPRESENTS PAST PERFORMANCE AND DOES NOT GUARANTEE FUTURE RESULTS. Investment return and principal value of an investment will fluctuate so that an investor’s shares, when redeemed, may be worth more or less than their original cost. Current performance may be lower or higher than the performance data quoted. For more information, including performance data current to the most recent month-end, please call 1-855-572-5945. Please consider the investment objectives, risks, charges and expenses of any investment option before investing.

Fund Prices & YTD Returns as of
1/1/1970
Performance Through
1/1/1970
Average Annual Returns Through
6/30/2026
Portfolio Name NAV NAV Daily Change % Daily Change % YTD Return One Month Three Months Six Months Since Inception One Year Three Years Five Years Ten Years Since Inception Inception Date Gross Expenses
TOPS Aggressive ETF Portfolio Class 1 0.00 0.00 0.00% 0.00% 0.00% 0.00% 0.00% 0.00% 27.55% 18.14% 9.81% 11.78% 9.60% 4/26/2011 0.29%
TOPS Aggressive ETF Portfolio Class 2 0.00 0.00 0.00% 0.00% 0.00% 0.00% 0.00% 0.00% 27.23% 17.85% 9.54% 11.50% 9.35% 4/26/2011 0.54%
TOPS Aggressive ETF Portfolio Investor Class 0.00 0.00 0.00% 0.00% 0.00% 0.00% 0.00% 0.00% 26.91% 17.54% 9.26% 11.06% 9.78% 7/22/2015 0.79%

This material must be preceded or accompanied by a prospectus, which outlines specific charges and expenses associated with the product, a hypothetical illustration showing the effect on performance of various assumptions regarding the cost of insurance protection, among other important information. Individuals may also obtain a personalized illustration of historical performance, which reflects the cost of the individual’s policy insurance protection. Please review this material with a current variable annuity prospectus, product material (product brochure or illustration) and the current monthly performance for the specific product.

TOPS® ETF Portfolios assess fees and expenses that are separate and distinct from each respective underlying insurance contract or fund option.

Please read the product and fund prospectuses carefully before you invest or send money. Investors should consider the investment objectives, strategies, risk factors, charges and expenses of the underlying variable portfolios carefully before investing. The fund prospectus contains this and other information about the underlying variable portfolios.

There is the risk that you could lose money through your investment in the portfolios. Many factors affect the portfolios’ net asset value and performance. The portfolios may be subject to credit risk where issuers might not make payments on debt securities, resulting in losses.

By investing in ETFs, the cost of investing in a portfolio will be higher than the cost of investing directly in the ETFs and may be higher than other mutual funds that invest directly in stocks and bonds. Foreign investing involves risks not typically associated with U.S. investments, including adverse fluctuations in foreign currency values, adverse political, social and economic developments, less liquidity, greater volatility, less developed or less efficient trading markets, political instability and differing auditing and legal standards. Foreign equity securities denominated in non-U.S. dollar currencies will subject a portfolio to currency trading risks that include market risk and country risk. It is possible to lose money by investing in securities.

The portfolio’s positions in lower-quality bonds, known as “high yield” or “junk” bonds, present greater risk than bonds of higher quality, including an increased risk of default. The portfolios’ exposure to companies primarily engaged in the natural resource markets may subject a portfolio to greater volatility than the securities market as a whole. Natural resource companies are affected by commodity price volatility, changes in interest rates, or factors affecting a particular industry or commodity, such as drought, floods, weather, livestock disease, embargoes, tariffs, and international economic, political and regulatory developments. Positions in small or medium capitalization company stocks may subject the portfolios to additional risk since they are subject to more abrupt or erratic market movements than those of larger, more established companies.

Volatility: a tendency to change quickly and unpredictably.

Real estate values rise and fall in response to a variety of factors, including local, regional and national economic conditions, interest rates and tax considerations.

PORTFOLIO DOCUMENTS

Click here to access fund documents.

TOPS® Managed Risk Balanced ETF Portfolio

TOPS® Managed Risk Balanced ETF Portfolio

ABOUT

TOPS Managed Risk Balanced

Allocation data is as of the most recently filed report. Portfolio allocations are subject to change and should not be considered investment advice.

The TOPS® Managed Risk Balanced ETF Portfolio seeks to provide income and capital appreciation with less volatility than the fixed income and equity markets as a whole.

ValMark believes the Portfolio is appropriate for investors with intermediate-term to long-term investment horizons who seek to balance out a desire for investment returns with a desire for lower levels of risk than typically found in funds with medium-to-aggressive asset allocation.

The Portfolio employs a fund-of-funds structure that invests 80% of its assets in ETFs. The ETFs included in the portfolio provide exposure to Government Fixed Income Securities, Corporate Fixed Income Securities, Common and Preferred Stocks, Real Estate-Related Securities and Natural Resource- Related Securities. The Portfolio also employs exchange-traded futures contracts to hedge market risk and reduce return volatility.

PERFORMANCE

The performance figures do not reflect charges specific to an individual’s contract, such as cost of insurance, mortality and expense risks charges, riders and sales charges, which would negatively affect performance. Returns greater than one year are annualized. Performance is provided based on rolling periods. PERFORMANCE DATA QUOTED REPRESENTS PAST PERFORMANCE AND DOES NOT GUARANTEE FUTURE RESULTS. Investment return and principal value of an investment will fluctuate so that an investor’s shares, when redeemed, may be worth more or less than their original cost. Current performance may be lower or higher than the performance data quoted. For more information, including performance data current to the most recent month-end, please call 1-855-572-5945. Please consider the investment objectives, risks, charges and expenses of any investment option before investing.

Fund Prices & YTD Returns as of
1/1/1970
Performance Through
1/1/1970
Average Annual Returns Through
6/30/2026
Portfolio Name NAV NAV Daily Change % Daily Change % YTD Return One Month Three Months Six Months Since Inception One Year Three Years Five Years Ten Years Since Inception Inception Date Gross Expenses
TOPS Managed Risk Balanced ETF Portfolio Class 1 0.00 0.00 0.00% 0.00% 0.00% 0.00% 0.00% 0.00% 13.93% 9.15% 4.19% 5.54% 4.86% 6/9/2011 0.51%
TOPS Managed Risk Balanced ETF Portfolio Class 2 0.00 0.00 0.00% 0.00% 0.00% 0.00% 0.00% 0.00% 13.59% 8.90% 3.93% 5.28% 4.60% 6/9/2011 0.76%
TOPS Managed Risk Balanced ETF Portfolio Class 3 0.00 0.00 0.00% 0.00% 0.00% 0.00% 0.00% 0.00% 13.44% 8.81% 3.83% 5.18% 4.56% 5/1/2012 0.86%
TOPS Managed Risk Balanced ETF Portfolio Class 4 0.00 0.00 0.00% 0.00% 0.00% 0.00% 0.00% 0.00% 13.17% 8.49% 3.57% 4.92% 4.22% 5/1/2012 1.11%
TOPS Managed Risk Balanced ETF Portfolio Investor Class 0.00 0.00 0.00% 0.00% 0.00% 0.00% 0.00% 0.00% 11.84% 7.66% -1.85% 2.13% 1.71% 7/22/2015 1.01%

This material must be preceded or accompanied by a prospectus, which outlines specific charges and expenses associated with the product, a hypothetical illustration showing the effect on performance of various assumptions regarding the cost of insurance protection, among other important information. Individuals may also obtain a personalized illustration of historical performance, which reflects the cost of the individual’s policy insurance protection. Please review this material with a current variable annuity prospectus, product material (product brochure or illustration) and the current monthly performance for the specific product.

TOPS® ETF Portfolios assess fees and expenses that are separate and distinct from each respective underlying insurance contract or fund option.

Please read the product and fund prospectuses carefully before you invest or send money. Investors should consider the investment objectives, strategies, risk factors, charges and expenses of the underlying variable portfolios carefully before investing. The fund prospectus contains this and other information about the underlying variable portfolios.

There is the risk that you could lose money through your investment in the portfolios. Many factors affect the portfolios’ net asset value and performance. The portfolios may be subject to credit risk where issuers might not make payments on debt securities, resulting in losses. Fixed income investments are affected by a number of risks, including fluctuation in interest rates, credit risk, and prepayment risk. In general, as prevailing interest rates rise, fixed income prices will fall. Real estate values rise and fall in response to a variety of factors, including local, regional and national economic conditions, interest rates and tax considerations. Futures contract positions may not provide an effective hedge because changes in futures contract prices may not track those of the ETFs they are intended to hedge. Futures create leverage, which can magnify the Portfolio’s potential for gain or loss and, therefore, amplify the effects of market volatility on the Portfolio’s share price.

By investing in ETFs, the cost of investing in a portfolio will be higher than the cost of investing directly in the ETFs and may be higher than other mutual funds that invest directly in stocks and bonds. Foreign investing involves risks not typically associated with U.S. investments, including adverse fluctuations in foreign currency values, adverse political, social and economic developments, less liquidity, greater volatility, less developed or less efficient trading markets, political instability and differing auditing and legal standards. Foreign equity securities denominated in non-U.S. dollar currencies will subject a portfolio to currency trading risks that include market risk and country risk. It is possible to lose money by investing in securities.

The portfolio’s positions in lower-quality bonds, known as “high yield” or “junk” bonds, present greater risk than bonds of higher quality, including an increased risk of default. The portfolios’ exposure to companies primarily engaged in the natural resource markets may subject a portfolio to greater volatility than the securities market as a whole. Natural resource companies are affected by commodity price volatility, changes in interest rates, or factors affecting a particular industry or commodity, such as drought, floods, weather, livestock disease, embargoes, tariffs, and international economic, political and regulatory developments. Positions in small or medium capitalization company stocks may subject the portfolios to additional risk since they are subject to more abrupt or erratic market movements than those of larger, more established companies.

Volatility: a tendency to change quickly and unpredictably.

PORTFOLIO DOCUMENTS

Click here to access fund documents.

TOPS® Managed Risk Moderate ETF Portfolio

TOPS® Managed Risk Moderate ETF Portfolio

ABOUT

TOPS_Managed Risk Moderate

Allocation data is as of the most recently filed report. Portfolio allocations are subject to change and should not be considered investment advice.

The TOPS® Managed Risk Moderate ETF Portfolio seeks capital appreciation with less volatility than the equity markets as a whole.

ValMark believes the Portfolio is appropriate for investors with long-term investment horizons who are willing to accept lower-to-moderate return volatility in pursuit of higher returns than are typically found in funds with more conservative asset allocation.

The Portfolio employs a fund-of-funds structure that invests 80% of its assets in ETFs. The ETFs included in the portfolio provide exposure to Government Fixed Income Securities, Corporate Fixed Income Securities, Common and Preferred Stocks, Real Estate-Related Securities and Natural Resource- Related Securities. The Portfolio also employs exchange-traded futures contracts to hedge market risk and reduce return volatility.

PERFORMANCE

The performance figures do not reflect charges specific to an individual’s contract, such as cost of insurance, mortality and expense risks charges, riders and sales charges, which would negatively affect performance. Returns greater than one year are annualized. Performance is provided based on rolling periods. PERFORMANCE DATA QUOTED REPRESENTS PAST PERFORMANCE AND DOES NOT GUARANTEE FUTURE RESULTS. Investment return and principal value of an investment will fluctuate so that an investor’s shares, when redeemed, may be worth more or less than their original cost. Current performance may be lower or higher than the performance data quoted. For more information, including performance data current to the most recent month-end, please call 1-855-572-5945. Please consider the investment objectives, risks, charges and expenses of any investment option before investing.

Fund Prices & YTD Returns as of
1/1/1970
Performance Through
1/1/1970
Average Annual Returns Through
6/30/2026
Portfolio Name NAV NAV Daily Change % Daily Change % YTD Return One Month Three Months Six Months Since Inception One Year Three Years Five Years Ten Years Since Inception Inception Date Gross Expenses
TOPS Managed Risk Moderate ETF Portfolio Class 1 0.00 0.00 0.00% 0.00% 0.00% 0.00% 0.00% 0.00% 17.45% 10.90% 5.09% 6.68% 5.60% 6/9/2011 0.50%
TOPS Managed Risk Moderate ETF Portfolio Class 2 0.00 0.00 0.00% 0.00% 0.00% 0.00% 0.00% 0.00% 17.23% 10.57% 4.85% 6.43% 5.36% 6/9/2011 0.75%
TOPS Managed Risk Moderate ETF Portfolio Class 3 0.00 0.00 0.00% 0.00% 0.00% 0.00% 0.00% 0.00% 17.05% 10.44% 4.73% 6.32% 5.33% 5/1/2012 0.85%
TOPS Managed Risk Moderate ETF Portfolio Class 4 0.00 0.00 0.00% 0.00% 0.00% 0.00% 0.00% 0.00% 16.81% 10.23% 4.48% 6.05% 5.09% 5/1/2012 1.10%
TOPS Managed Risk Moderate ETF Portfolio Investor Class 0.00 0.00 0.00% 0.00% 0.00% 0.00% 0.00% 0.00% 17.37% 7.94% 3.30% 5.44% 4.39% 7/22/2015 1.00%

This material must be preceded or accompanied by a prospectus, which outlines specific charges and expenses associated with the product, a hypothetical illustration showing the effect on performance of various assumptions regarding the cost of insurance protection, among other important information. Individuals may also obtain a personalized illustration of historical performance, which reflects the cost of the individual’s policy insurance protection. Please review this material with a current variable annuity prospectus, product material (product brochure or illustration) and the current monthly performance for the specific product.

TOPS® ETF Portfolios assess fees and expenses that are separate and distinct from each respective underlying insurance contract or fund option.

Please read the product and fund prospectuses carefully before you invest or send money. Investors should consider the investment objectives, strategies, risk factors, charges and expenses of the underlying variable portfolios carefully before investing. The fund prospectus contains this and other information about the underlying variable portfolios.

There is the risk that you could lose money through your investment in the portfolios. Many factors affect the portfolios’ net asset value and performance. The portfolios may be subject to credit risk where issuers might not make payments on debt securities, resulting in losses. Fixed income investments are affected by a number of risks, including fluctuation in interest rates, credit risk, and prepayment risk. In general, as prevailing interest rates rise, fixed income prices will fall. Real estate values rise and fall in response to a variety of factors, including local, regional and national economic conditions, interest rates and tax considerations. Futures contract positions may not provide an effective hedge because changes in futures contract prices may not track those of the ETFs they are intended to hedge. Futures create leverage, which can magnify the Portfolio’s potential for gain or loss and, therefore, amplify the effects of market volatility on the Portfolio’s share price.

By investing in ETFs, the cost of investing in a portfolio will be higher than the cost of investing directly in the ETFs and may be higher than other mutual funds that invest directly in stocks and bonds. Foreign investing involves risks not typically associated with U.S. investments, including adverse fluctuations in foreign currency values, adverse political, social and economic developments, less liquidity, greater volatility, less developed or less efficient trading markets, political instability and differing auditing and legal standards. Foreign equity securities denominated in non-U.S. dollar currencies will subject a portfolio to currency trading risks that include market risk and country risk. It is possible to lose money by investing in securities.

The portfolio’s positions in lower-quality bonds, known as “high yield” or “junk” bonds, present greater risk than bonds of higher quality, including an increased risk of default. The portfolios’ exposure to companies primarily engaged in the natural resource markets may subject a portfolio to greater volatility than the securities market as a whole. Natural resource companies are affected by commodity price volatility, changes in interest rates, or factors affecting a particular industry or commodity, such as drought, floods, weather, livestock disease, embargoes, tariffs, and international economic, political and regulatory developments. Positions in small or medium capitalization company stocks may subject the portfolios to additional risk since they are subject to more abrupt or erratic market movements than those of larger, more established companies.

Volatility: a tendency to change quickly and unpredictably.

PORTFOLIO DOCUMENTS

Click here to access fund documents.

TOPS® Managed Risk Moderately Aggressive ETF Portfolio

TOPS® Managed Risk Moderately Aggressive ETF Portfolio

ABOUT

TOPS® Managed Risk Moderately Aggressive ETF Portfolio

Allocation data is as of the most recently filed report. Portfolio allocations are subject to change and should not be considered investment advice.

The TOPS® Managed Risk Moderately Aggressive ETF Portfolio seeks capital appreciation with less volatility than the equity markets as a whole.

ValMark believes the Portfolio is appropriate for investors with long-term investment horizons who are willing to accept moderate return volatility in pursuit of higher returns.

The Portfolio employs a fund-of-funds structure that invests 80% of its assets in ETFs. The ETFs included in the portfolio provide exposure to Government Fixed Income Securities, Corporate Fixed Income Securities, Common and Preferred Stocks, Real Estate-Related Securities and Natural Resource- Related Securities. The Portfolio also employs exchange-traded futures contracts to hedge market risk and reduce return volatility.

PERFORMANCE

The performance figures do not reflect charges specific to an individual’s contract, such as cost of insurance, mortality and expense risks charges, riders and sales charges, which would negatively affect performance. Returns greater than one year are annualized. Performance is provided based on rolling periods. PERFORMANCE DATA QUOTED REPRESENTS PAST PERFORMANCE AND DOES NOT GUARANTEE FUTURE RESULTS. Investment return and principal value of an investment will fluctuate so that an investor’s shares, when redeemed, may be worth more or less than their original cost. Current performance may be lower or higher than the performance data quoted. For more information, including performance data current to the most recent month-end, please call 1-855-572-5945. Please consider the investment objectives, risks, charges and expenses of any investment option before investing.

Fund Prices & YTD Returns as of
1/1/1970
Performance Through
1/1/1970
Average Annual Returns Through
6/30/2026
Portfolio Name NAV NAV Daily Change % Daily Change % YTD Return One Month Three Months Six Months Since Inception One Year Three Years Five Years Ten Years Since Inception Inception Date Gross Expenses
TOPS Managed Risk Moderately Aggressive ETF Portfolio Class 1 0.00 0.00 0.00% 0.00% 0.00% 0.00% 0.00% 0.00% 22.27% 12.43% 5.96% 7.44% 5.59% 4/26/2011 0.50%
TOPS Managed Risk Moderately Aggressive ETF Portfolio Class 2 0.00 0.00 0.00% 0.00% 0.00% 0.00% 0.00% 0.00% 22.00% 12.13% 5.68% 7.17% 5.33% 4/26/2011 0.75%
TOPS Managed Risk Moderately Aggressive ETF Portfolio Class 3 0.00 0.00 0.00% 0.00% 0.00% 0.00% 0.00% 0.00% 21.86% 12.02% 5.59% 7.07% 5.67% 5/1/2012 0.85%
TOPS Managed Risk Moderately Aggressive ETF Portfolio Class 4 0.00 0.00 0.00% 0.00% 0.00% 0.00% 0.00% 0.00% 21.58% 11.77% 5.34% 6.82% 5.49% 5/1/2012 1.10%
TOPS Managed Risk Moderately Aggressive ETF Portfolio Investor Class 0.00 0.00 0.00% 0.00% 0.00% 0.00% 0.00% 0.00% 22.08% 12.19% 5.67% 6.98% 5.55% 7/22/2015 1.00%

This material must be preceded or accompanied by a prospectus, which outlines specific charges and expenses associated with the product, a hypothetical illustration showing the effect on performance of various assumptions regarding the cost of insurance protection, among other important information. Individuals may also obtain a personalized illustration of historical performance, which reflects the cost of the individual’s policy insurance protection. Please review this material with a current variable annuity prospectus, product material (product brochure or illustration) and the current monthly performance for the specific product.

TOPS® ETF Portfolios assess fees and expenses that are separate and distinct from each respective underlying insurance contract or fund option.

Please read the product and fund prospectuses carefully before you invest or send money. Investors should consider the investment objectives, strategies, risk factors, charges and expenses of the underlying variable portfolios carefully before investing. The fund prospectus contains this and other information about the underlying variable portfolios.

There is the risk that you could lose money through your investment in the portfolios. Many factors affect the portfolios’ net asset value and performance. The portfolios may be subject to credit risk where issuers might not make payments on debt securities, resulting in losses. Fixed income investments are affected by a number of risks, including fluctuation in interest rates, credit risk, and prepayment risk. In general, as prevailing interest rates rise, fixed income prices will fall. Real estate values rise and fall in response to a variety of factors, including local, regional and national economic conditions, interest rates and tax considerations. Futures contract positions may not provide an effective hedge because changes in futures contract prices may not track those of the ETFs they are intended to hedge. Futures create leverage, which can magnify the Portfolio’s potential for gain or loss and, therefore, amplify the effects of market volatility on the Portfolio’s share price.

By investing in ETFs, the cost of investing in a portfolio will be higher than the cost of investing directly in the ETFs and may be higher than other mutual funds that invest directly in stocks and bonds. Foreign investing involves risks not typically associated with U.S. investments, including adverse fluctuations in foreign currency values, adverse political, social and economic developments, less liquidity, greater volatility, less developed or less efficient trading markets, political instability and differing auditing and legal standards. Foreign equity securities denominated in non-U.S. dollar currencies will subject a portfolio to currency trading risks that include market risk and country risk. It is possible to lose money by investing in securities.

The portfolio’s positions in lower-quality bonds, known as “high yield” or “junk” bonds, present greater risk than bonds of higher quality, including an increased risk of default. The portfolios’ exposure to companies primarily engaged in the natural resource markets may subject a portfolio to greater volatility than the securities market as a whole. Natural resource companies are affected by commodity price volatility, changes in interest rates, or factors affecting a particular industry or commodity, such as drought, floods, weather, livestock disease, embargoes, tariffs, and international economic, political and regulatory developments. Positions in small or medium capitalization company stocks may subject the portfolios to additional risk since they are subject to more abrupt or erratic market movements than those of larger, more established companies.

Volatility: a tendency to change quickly and unpredictably.

PORTFOLIO DOCUMENTS

Click here to access fund documents.

TOPS® Managed Risk Flex ETF Portfolio

TOPS® Managed Risk Flex ETF Portfolio

ABOUT

TOPS_Managed Risk Flex-02

Allocation data is as of the most recently filed report. Portfolio allocations are subject to change and should not be considered investment advice.

The TOPS® Managed Risk Flex ETF Portfolio seeks to provide income and capital appreciation with less volatility than the fixed income and equity markets as a whole.

ValMark believes the Portfolio is appropriate for investors with intermediate-term to long-term investment horizons who seek to balance out a desire for investment returns with a desire for lower levels of risk than typically found in funds with medium-to-aggressive asset allocation.

The Portfolio employs a fund-of-funds structure that invests 80% of its assets in ETFs. The ETFs included in the portfolio provide exposure to Government Fixed Income Securities, Corporate Fixed Income Securities, Common and Preferred Stocks, Real Estate-Related Securities and Natural Resource- Related Securities. The Portfolio also employs exchange-traded futures contracts to hedge market risk and reduce return volatility.

PERFORMANCE

The performance figures do not reflect charges specific to an individual’s contract, such as cost of insurance, mortality and expense risks charges, riders and sales charges, which would negatively affect performance. Returns greater than one year are annualized. Performance is provided based on rolling periods. PERFORMANCE DATA QUOTED REPRESENTS PAST PERFORMANCE AND DOES NOT GUARANTEE FUTURE RESULTS. Investment return and principal value of an investment will fluctuate so that an investor’s shares, when redeemed, may be worth more or less than their original cost. Current performance may be lower or higher than the performance data quoted. For more information, including performance data current to the most recent month-end, please call 1-855-572-5945. Please consider the investment objectives, risks, charges and expenses of any investment option before investing.

Fund Prices & YTD Returns as of
1/1/1970
Performance Through
1/1/1970
Average Annual Returns Through
6/30/2026
Portfolio Name NAV NAV Daily Change % Daily Change % YTD Return One Month Three Months Six Months Since Inception One Year Three Years Five Years Ten Years Since Inception Inception Date Gross Expenses
TOPS Managed Risk Flex ETF Portfolio 0.00 0.00 0.00% 0.00% 0.00% 0.00% 0.00% 0.00% 14.45% 9.11% 4.02% 5.31% 4.55% 8/27/2013 0.95%

This material must be preceded or accompanied by a prospectus, which outlines specific charges and expenses associated with the product, a hypothetical illustration showing the effect on performance of various assumptions regarding the cost of insurance protection, among other important information. Individuals may also obtain a personalized illustration of historical performance, which reflects the cost of the individual’s policy insurance protection. Please review this material with a current variable annuity prospectus, product material (product brochure or illustration) and the current monthly performance for the specific product.

TOPS® ETF Portfolios assess fees and expenses that are separate and distinct from each respective underlying insurance contract or fund option.

Please read the product and fund prospectuses carefully before you invest or send money. Investors should consider the investment objectives, strategies, risk factors, charges and expenses of the underlying variable portfolios carefully before investing. The fund prospectus contains this and other information about the underlying variable portfolios.

There is the risk that you could lose money through your investment in the portfolios. Many factors affect the portfolios’ net asset value and performance. The portfolios may be subject to credit risk where issuers might not make payments on debt securities, resulting in losses. Fixed income investments are affected by a number of risks, including fluctuation in interest rates, credit risk, and prepayment risk. In general, as prevailing interest rates rise, fixed income prices will fall. Real estate values rise and fall in response to a variety of factors, including local, regional and national economic conditions, interest rates and tax considerations. Futures contract positions may not provide an effective hedge because changes in futures contract prices may not track those of the ETFs they are intended to hedge. Futures create leverage, which can magnify the Portfolio’s potential for gain or loss and, therefore, amplify the effects of market volatility on the Portfolio’s share price.

By investing in ETFs, the cost of investing in a portfolio will be higher than the cost of investing directly in the ETFs and may be higher than other mutual funds that invest directly in stocks and bonds. Foreign investing involves risks not typically associated with U.S. investments, including adverse fluctuations in foreign currency values, adverse political, social and economic developments, less liquidity, greater volatility, less developed or less efficient trading markets, political instability and differing auditing and legal standards. Foreign equity securities denominated in non-U.S. dollar currencies will subject a portfolio to currency trading risks that include market risk and country risk. It is possible to lose money by investing in securities.

The portfolio’s positions in lower-quality bonds, known as “high yield” or “junk” bonds, present greater risk than bonds of higher quality, including an increased risk of default. The portfolios’ exposure to companies primarily engaged in the natural resource markets may subject a portfolio to greater volatility than the securities market as a whole. Natural resource companies are affected by commodity price volatility, changes in interest rates, or factors affecting a particular industry or commodity, such as drought, floods, weather, livestock disease, embargoes, tariffs, and international economic, political and regulatory developments. Positions in small or medium capitalization company stocks may subject the portfolios to additional risk since they are subject to more abrupt or erratic market movements than those of larger, more established companies.

Volatility: a tendency to change quickly and unpredictably.

PORTFOLIO DOCUMENTS

Click here to access fund documents.

Investors should carefully consider the investment objectives, risks, charges and  expenses of the TOPS® ETF Portfolios. This and other important information about the portfolios are contained in the prospectus, which can be obtained by calling 1-855-572-5945. The prospectus should be read carefully before investing. The TOPS® ETF Portfolios are managed by ValMark Advisers, Inc. and distributed by Northern Lights Distributors, LLC, member FINRA/SIPC. Northern Lights Distributors, LLC is not affiliated with ValMark Advisers, Inc. or Milliman, Inc.